A Maiden Data Science Voyage on the Titanic
For my dissertation at university I worked on creating a Reinforcement Learning (RL) agent that could play Tetris. Since then, much to my sadness, I have not spent too much time doing any machine learning (ML) projects. I wanted to change that and so I spent some time learning some of the fundamentals for ML that I had not dusted off since the painful days and long nights of trying to get my RL agent to place blocks in a row. I say "learning some of the fundamentals for ML" because my dissertation work focussed specifically on RL; those that remember final year at a British university know that they are incredibly busy periods, and sometimes one glosses over some of the fundamentals of topics.
Anyhow, after brushing up on the fundamentals, I stumbled upon the Titanic ML competition on Kaggle - a data-science competition platform. I have seen the competition described as somewhat of a "Hello World!" competition for budding data scientists. The premise of the competition is simple: given certain features of passengers, create a model that accurately classifies whether a passenger will have survived or perished during the sinking of the White Star Line's RMS Titanic.
Competitors are given 9 features to utilise and in the training data a classification on whether that passenger survived. These features are:
- pclass: The ticket class of the passenger which is either 1st class, 2nd class and 3rd class - which was called steerage aboard the actual Titanic.
- sex: The sex of the passenger categorised as Male / Female.
- Age: The age of the passenger.
- sibsp: The number of the passenger's siblings or spouses aboard the ship.
- parch: The number of the passenger's parents or children aboard the ship.
- ticket: The ticket number.
- fare: The fare paid for the ticket.
- cabin: The cabin number.
- embarked: The Port of Embarkation, either Cherbourg (C), Queenstown (Q) or Southampton (S).
In the training data there is also a feature called "Survived", where 0 means the passenger perished and 1 means the passenger survived.
I found that this challenge sounded interesting and set off on starting it. I told myself I would be happy with a model that predicted correctly 66% or more of the time, given that this is the first Kaggle competition I have done and I was a little rusty on machine learning.
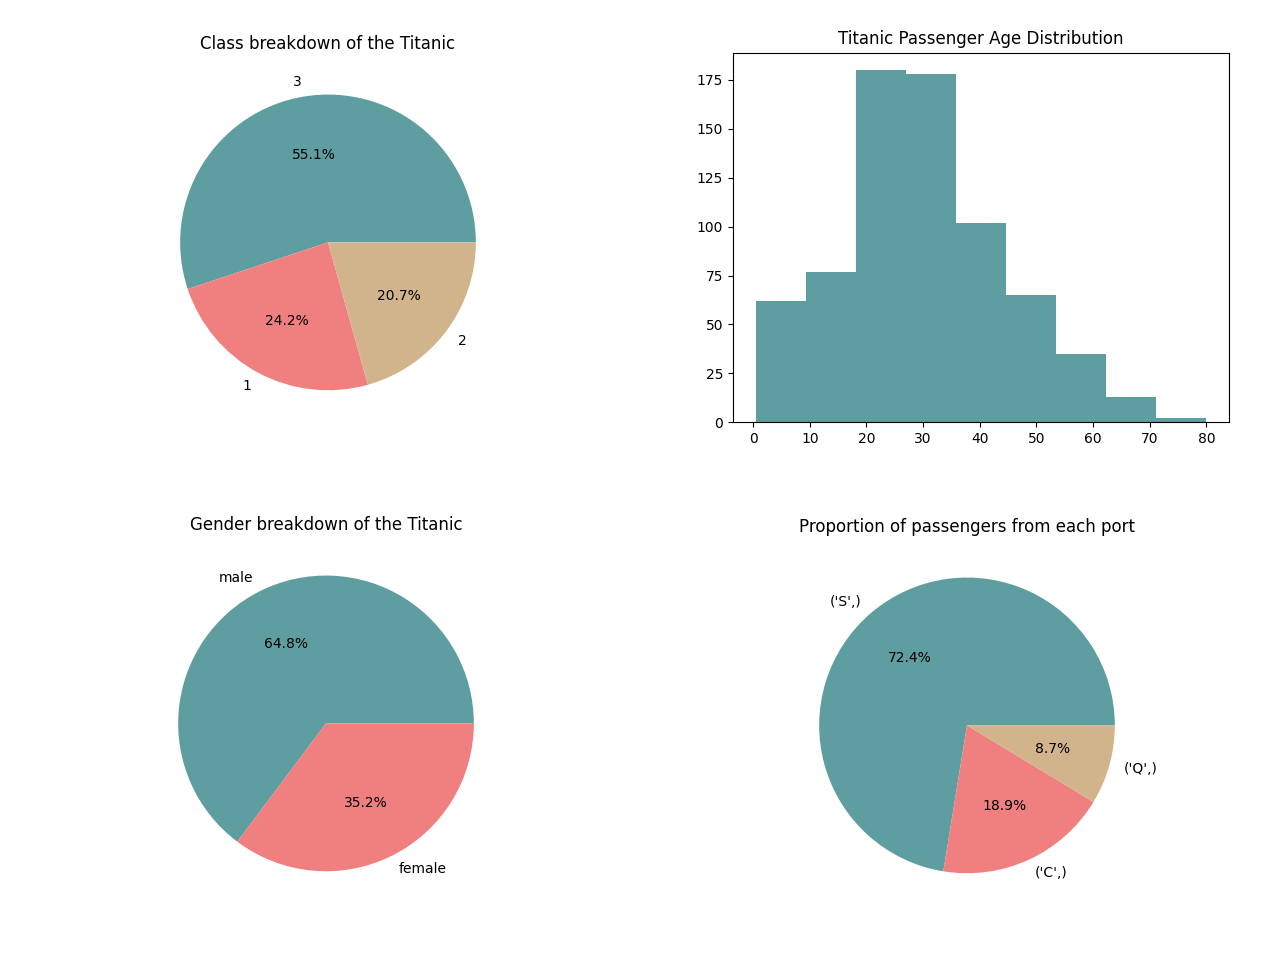
I started off performing exploratory data analysis. I looked at the percentage of survivors, the sex and class breakdown of the voyage, the proportion of passengers from each port and the age distribution. The majority of those on the ship were male, in steerage and boarded from Southampton. The most common age bracket aboard the ship was 20 - 40. You can see the graphs I generated below.
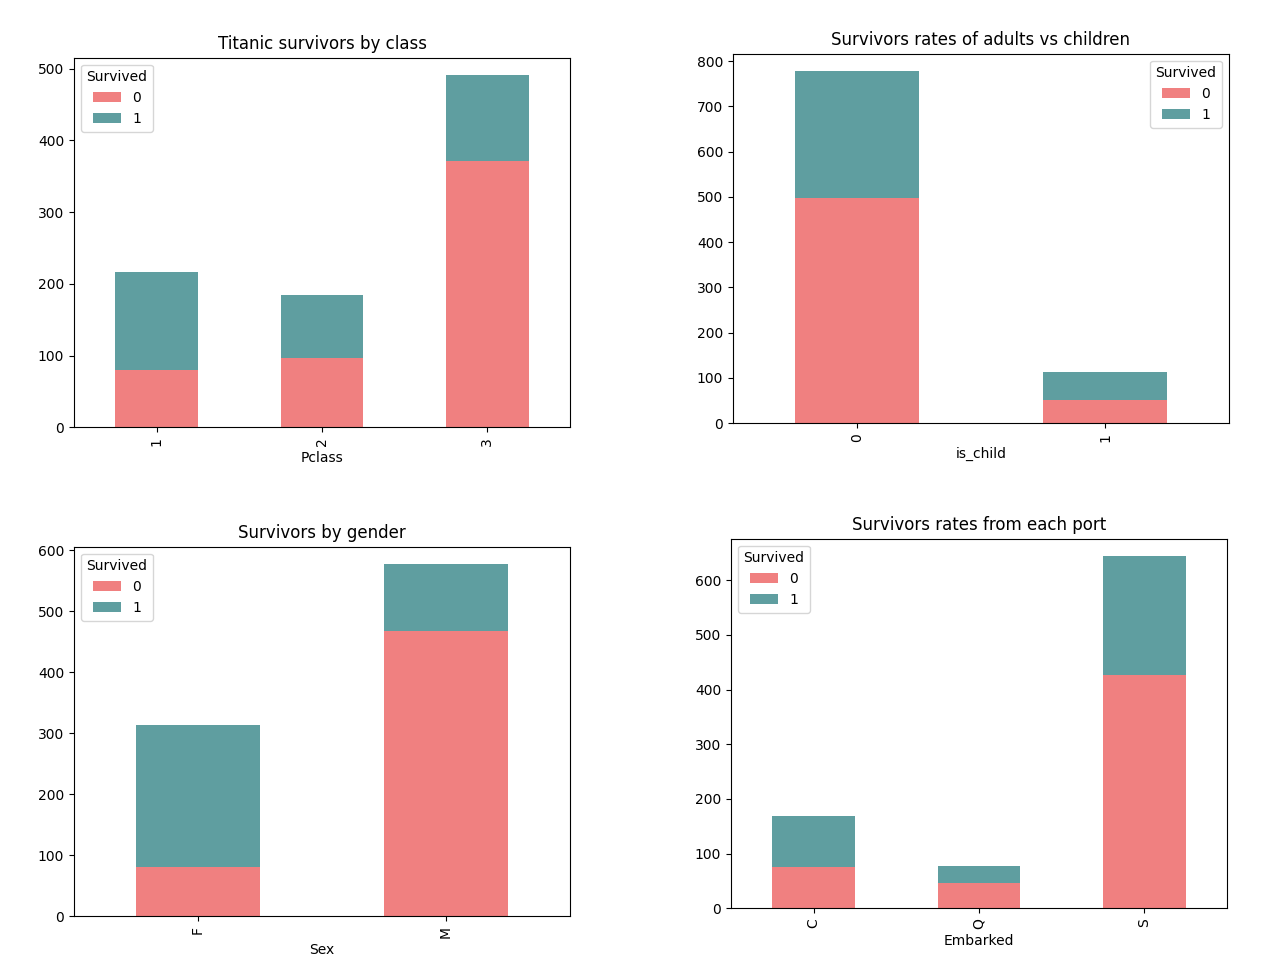
If you know the unfortunate tale of the Titanic, you will know that majority did not rule. Indeed, "women and children first!" rests well in the public conscience of the Titanic disaster, along with the classism that those from poorer backgrounds - those in steerage - experienced during the evacuation of the RMS Titanic. Further exploratory data analysis confirmed this, revealing that you were more likely to survive if you were a woman and under the age of 40. The lower class your ticket, the more likely you were to die. This really seemed in-line with the public conscience of the Titanic disaster, and so I set about creating a model. I really had gotten in to my head that class, whether you were a child or not and your sex were the most important factors.
I feature engineered a feature called is_child - whether
you were under 18 - and fed that into a decision tree model alongside
pclass and sex, which had been reworked into a feature called
is_female. The decision tree model itself was
surprisingly accurate, gaining a score of 0.7751 (77.51% accuracy). I
managed to smash through my rather humble goal! I also tried it with
an artificial neural network (ANN) - because why not? It was less
accurate than my humble decision tree.
Before I continue, I want to mention that the classifiers I used throughout this project - such as the decision tree and ANN used above - are well documented. I will not be going into details on how they work, but they are all well-known and their details can easily be found online.
I was happy with my score being over 10% more accurate than I had initially hoped, but I decided to set a new goal of 80% accuracy.
I decided that perhaps I should remove the
is_child feature and go directly for age. In some of the
rows of the training data the age was actually missing. I therefore
had to clean the data somewhat. I decided to fill any missing age rows
with the median age, as the age of the passengers is not normally
distributed. It felt like a rather simple approach, but I thought it
would be good enough; in actual fact this approach dropped the
accuracy of the model significantly. I was disappointed but I had an
intuition that this was the correct path to go down. I tried to be a
bit smarter with my tidying of the missing age. Rather than just fill
the missing age of a passenger with the median age of the
whole ship, I decided to fill it with the median age of the
passengers that were the same sex and in the same passenger class. For
example, if a female passenger in 2nd class had a missing age then
their age would be assigned the median value of ages for all females
within 2nd class. I tried this with a few different classifiers: ANNs,
Decision Trees, Random Forests and K-nearest neighbours. The majority
of these were of similar accuracy to my original decision tree,
however the ANN slightly increased in accuracy to 77.99%. An
improvement, but nearly 2% off of the accuracy I would be happy with.
I felt like I had exhausted my age, sex and class model so I went on the search for some more features I could use. I found proportionally a passenger was more likely to survive if they had a parent-child relation; a passenger was more likely to perish during the disaster if they had no siblings or spouses aboard the ship. Adding these features to models improved the less accurate models, but they appeared to be hitting a ceiling at 77.99% again. I tried adding another feature - embarked - to the models, as those embarking from Southampton were the largest proportion of deceased aboard the ship, relative to the number of passengers that embarked from the same port. This feature did not increase accuracy either.
At this point, perhaps I should have done some feature importance analysis. For whatever reason - perhaps impatience - I did not. Instead I decided to shift my gaze to hyperparameter tuning. Before we train our classifiers to create our models, we need to decide certain parameters for our classifiers; this could be the number of neurons in a hidden layer for an ANN or how many neighbours we compare against in a K-nearest neighbours classifier. The best hyperparameters for a model are not set in stone and indeed they change depending on the problem they are trying to solve. This can be quite a fiddly task and so tools such as grid searching and random searching exist. For each of my models that I was tuning hyperparemeters for, I started with grid search across a broad range of possible hyperparameters and then iteratively focussed on ever-smaller ranges using random search so that I could slowly focus on the best hyperparameters for my models. Finally, there was a minor breakthrough! After hyperparameter tuning and using the latest feature set (sex, age, parch, sibsp, pclass, embarked) my random forest model reached an accuracy of 78.468% and my ANN model reached an accuracy of 79.665%. I was so close to hitting my secondary goal of 80% but I started to realise I had spent too much time on this project. I had one final thing to try: the voting classifier.
The voting classifier is a classifiers that takes in multiple other classifiers. These input classifiers then vote on what they think the classification is. The classification with the most votes wins and that is what the row is classified as. Unfortunately, the model did not beat the most accurate model of the ANN's 79.665%; it did however beat the hypertuned random forest.
The best model was a hypertuned artificial neural network with a single hidden layer of neurons that took into account sex, age, pclass, age, embarkation location and whether the passenger's relations were also on the ship.
With my models, I smashed through my initial goal of 66% accuracy and I was so close to hitting my secondary goal of 80%. I make myself feel better by saying the difference between 79.665% and 80% is tiny, we just need to round to the nearest whole number. I believe if I had more time then perhaps I could have hit 80% accuracy, however I was spending far too long on this side project, if I am honest.
I really am glad I did this competition and I feel like I have learnt a lot from applying my knowledge of supervised learning classifiers and data exploration. If I were to carry on, I believe the correct path would be measuring the importance of the features we have and remove any that are mostly irrelevant in order to prevent overfitting. I would then look at the other features that I have not used to see if I can gain any insights from them. I would also try some different classifiers out, as some may be better suited for this problem than the ones I have used. A problem for the future perhaps, but until then I shall continue applying data science knowledge, working on other side projects and building and sharing my knowledge with you.